· 9 min read

You can’t swing a bat without hitting something AI these days.

workout

TrillaBit has also stepped into this realm, and we’re genuinely excited about it. Our aim is to provide you with a solid foundation you can rely on.

We get it, cutting through the noise to see what’s really going on can be tough. Somewhere between the lofty predictions of the future and the more tangible implementations like chatGPT (along with numerous other LLMs and RAG pipelines), there is solid ground to stand on.

AI encompasses a wide range of algorithms, techniques, and applications. When you mix this already complex tech world with people’s imaginations, well… understanding the current state can be a bit fuzzy. Often, what you see is a prototype representing just 20% of a vision, followed by a lot of talk about the vision.

I asked chatGPT why the term ‘AI’ is confusing, and here’s the gist of the response:

"Overall, the term 'AI' can be confusing because it represents a diverse and evolving field with implications that extend across technology, ethics, society, and more. Clarity often comes from breaking down AI into its components, understanding its current capabilities, and discussing its potential impacts in specific contexts." ~ChatGPT

Given the confusion around the current state, let’s start by clearing some of this up. Describing the current state is tricky because things are evolving rapidly. It’s a bit like driving a car—you don’t look out the side windows to figure out where you are. When you're going fast, you focus on the road ahead to see where you're headed and those signs just up ahead to know where you are. You might not see the entire path, but you have a good sense of where you're headed.

GenAI Today

A scope limited perspective

If you ask ChatGPT what applications AI covers today, it will provide a long list and then tell you, these are just a ‘few things’. Obviously the impact on our lives is quite extensive.

What I’m seeing in our space today however still has its limitations. For instance, LLMs are amazing at natural language processing. They have been trained across vast amounts of text. But even so, we’ve still had to augment models with search engine, vector database technology to now include proprietary data within enterprises. RAG pipelines are one way to build a model from some static data and enhance it with other text on implementation, typically proprietary data.

Then we have NLP(Natural Language Processing) for SQL. It’s more task-specific than the general-purpose LLMs like GPT. The primary focus of NLP for SQL systems is to understand and convert natural language queries into SQL, making it a specialized subset within the broader field of natural language processing. But NLP for SQL still isn’t able to create highly complex SQL statements yet, and often still makes mistakes. There’s still a lot of work to do here… If you’ve seen even a portion of the data models I have in my career, you’ll know the craziness that people have implemented. From the strangest naming conventions, to the ugliest of models…. Let’s just say 3rd normal form and above have certainly not been respected almost anywhere. Every implementation is different and learning from this certainly isn’t generic. Although I don’t doubt that AI will be able to navigate this someday, I think we’re a ways off. Today, it’s one model at a time.

Databases are here to stay, and so is the need for data security. We not only have to deal with proprietary data models and information, but also the challenge of securing this data across different roles, locations, and organizational levels.

I believe this is why, for the past year or so, AI in the analytic tooling space has been tied to either tools for developers themselves, or they’ve been applied to a limited context, like spreadsheets. If you have access to a spreadsheet, then you have access to all the data within that spreadsheet, and therefore we don’t need to worry about security when using nlp to dynamically build some dashboard on the spreadsheet.

For developer tools, it’s an efficient assistant. Let AI build out the code quickly, then the developer can enhance it (fix it) and implement it without the security risk.

Currently the best implementations today involve a human in the middle or simplified context. Nothing wrong with this, but why does it need to be a developer in the middle?

Bucking the Trend

bucking_the_trend

TrillaBit is aiming to buck the current trend. Our vision isn’t to build tools for developers, but build out self-service to ALL users while accommodating the AI inconsistencies that exist today. Practical implementations that users find useful and can work with.

Let me explain... The bandwagon trend for many tools today is to implement whatever exists in AI so they can give it to developers. Let’s say NLP for SQL. As a developer you need to build out dashboards, so you use an AI plugin to ask a question and it will return a SQL statement for you. Now you can use that SQL statement to build out your visualization. Although you may need to tweak it, because it didn’t really translate your ambiguous language well enough and it can’t really create that more complex query that you actually wanted, but hey! you saved a little time, and the product gets to say they’ve implemented AI! Win win!... sort of.

Bucking the Trend: What if… instead, AI didn’t return SQL? What if instead it returned something more simple. Like tags, tags that are not ambiguous and relate to more complex sql statements. Something that is easy to understand, and modify to get exactly what you want!

Imagine asking a question and getting back a graph visualization, and a set of tags that you can easily modify because they’re not as complex as the SQL language. All data returned is secured to you and you can now drill down into that visualization to explore your data.

The SQL is still generated in the backend and securely executed against your data model, but presented in an easy to use way. A more user-friendly way.

TrillaBit GenAI Features

When it comes to new industry and life changing tech like GenAI, we need to push the envelope and reach for the real value. Copying the next guy might give companies something to talk about, but TrillaBit strives to deliver value. To deliver practical GenAI features directly to the end user.

TrillaBit is already built to leverage metadata over traditional development tools. This approach allows for dynamic control over data exploration, analytics and collaboration with embedded security. Enhancing this dynamic platform with GenAI just makes sense and is the obvious next step in our evolution.

I’ll just highlight a few of the features here, as what we’re actually doing would take so much more time to get into. And we will, so stay tuned!

Early TrillaBit GenAI Features:

1. NLP KPI

Natural Language to a fully visualized, editable, drillable, sharable and secure KPI. Far beyond a SQL statement.

Most end users don’t want to have to deal with technical languages. They want to get on with running their business. Allowing for Natural Language gets us one step closer to this.

If you want to understand more about TrillaBit’s more robust solutioning, please feel free to reach out!

2. Attribute level Descriptive Text.

By training our models on thousands of datasets, AI can start to learn which attributes you are using within your context. With a simple explanation of the dataset, we can feed our AI the meta data to provide descriptions of each attribute within.

This removes a great deal of tedious work we don’t really wish on anyone. Ask your database people, in many cases, this level of valuable documentation just isn’t done…. Because no one wants to do it.

3. KPI level Descriptive Text

Our Gen AI can also provide descriptive text on what the resulting KPI is. This is useful for end users who might not fully understand what the actual analytic is just based on a title and some axis labels.

Just like other levels, this often isn’t done. But then the analytics are delivered and people are asking… what is this again? Again, this level of valuable documentation just isn’t done, because no one wants to spend the time doing it.

4. AI Generated Dashboards

This is nothing short of amazing! Based on the metadata and the context of a dataset, Our AI can automatically create a basic dashboard for you with many kpis specific to the context. And all the descriptions added for you.

Going beyond the norm, because we are not just generating SQL, all of the Security and functionality will already be built into each KPI within the dashboard. Drill down, Modification, Sharing, ability to quickly edit the KPI and copy it to other dashboards. All for end-user self-service. Amazing!

As is today, dashboards can remain domain, workspace, group or user level. If you want to learn more about the TrillaBit platform and the amazing things we’re doing already, please contact us!

5. Alternative Perspectives

When you create a kpi, you’re essentially answering a business question. But what if the system can provide alternative perspectives on that question?

When you create a KPI, you will receive a list of possible alternative KPIs around the same context as your business question. Essentially providing you with different perspectives.

When you work with a mentor or colleague, they may often provide you with feedback or alternative thinking as you work through a problem. This is a type of co-pilot implementation to help you on your data exploration journey. Courtesy of TrillaBit and GenAI!

Future plans…

We have a lot… but we’re keeping a lid on that for now.

In summary I believe TrillaBit is making great strides in innovation and providing a platform to benefit B2B SaaS companies as they strive for competitive advantage in this newly fast moving GenAI world.

We will expand on this as we go, but if you would like to know more, sooner, Please feel free to reach out to us! We’ll be happy to get into more details!

Thanks,

Keith

quote “We are the music makers and we are the dreamers of dreams” ~ Willy Wonka" :::

· 4 min read

ACTUALLY… by the time you read this…. IT’S HERE!

WE’RE RUNNING ON SNOWFLAKE!

leap

How it was

So we’ve been doing this for a while. Decades actually. Early on I was running denormalized dimensional modeling on row based databases and squeezing every ounce of performance out if it that I could. Pre-aggregating years of transactional data and preprocessing as much as I could to get that fast end user experience. Of course this wasn’t highly efficient or cost effective, and we couldn’t easily or dynamically get back down to fine grained data.

Back then we poured over every detail down to the actual hardware, io and memory etc. (it mattered what the disk controller was and how our raid array was configured), we kept processing as close to the data as possible… basically because we had to, to get any kind of real performance. Then a world of change happened. Distributed processing and columnar stores. Eventually columnar stores became the de facto standard for analytics. This makes a lot of sense. It’s more aligned with how data is read for analytics, reduces io with higher data compression rates, and the models lend themselves better to distributed processing.

Then came big data - and with it columnar based file formats from hadoop, like parquet and orc. The cloud became a bigger thing and data lakes were the way to go. But they weren’t something that was prepackaged for you like the databases of yore. You had to build them almost from scratch, and it wasn’t easy. Your query engine was separate from your index store and separate from your data storage. You needed to handle the writing with integrity on failure. Understanding Hadoop was a big thing and tools felt like they were lego bricks you needed to click together in just the right way.

snowflake

A better way

With the arrival of Snowflake things changed for the better again. It handled so much for you, providing that ‘database engine feel’ on big data infrastructure. Beautiful! Because of this, Snowflake became popular in no time. It grew like crazy and became a desired tech because it made modern approaches more accessible.

What was making big data costly and expensive was resourcing (human, hardware), Snowflake helped cut those by abstracting all the complexity of big data ecosystems from developers and letting you just write basic SQL. It handled the hardware aspects of the lake, instead of spinning up and managing a farm of hardware and machines to process everything. Snowflake just took care of it all. The separation of storage and compute allowed you to minimize your data footprint, and maximize your processing… elasticity! Running the required resources for a particular process for a limited period of time lowered your cost (the headache of dealing with node failure was gone too). Your developers could focus on implementing business needs rather than constantly maintaining and enhancing the big data cluster.

trillabit

Our Value Add

Enter onto the scene the next step in capabilities and simplification - TrillaBit. We created a smart low-code analytics layer that dynamically runs on top of highly performant and efficient analytic processing platforms like Snowflake. We help you leverage your Snowflake investment further by letting users drill into and explore data at their whim, without knowing sql or other underlying tech.

TrillaBit can now simply point to an instance or multiple instances of Snowflake, locally or globally to provide self service analytics to users in the most efficient and cost effective way.

Thanks,

Keith

quote

“We are the music makers and we are the dreamers of dreams” ~ Willy Wonka"

contact us!

· 6 min read

TrillaBit is enabling Analytic Cards for dashboards.

Analytic Cards

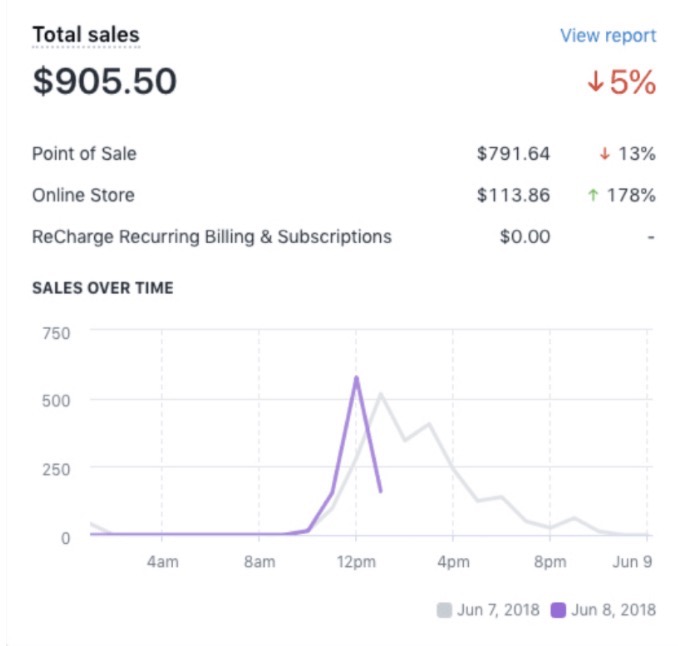
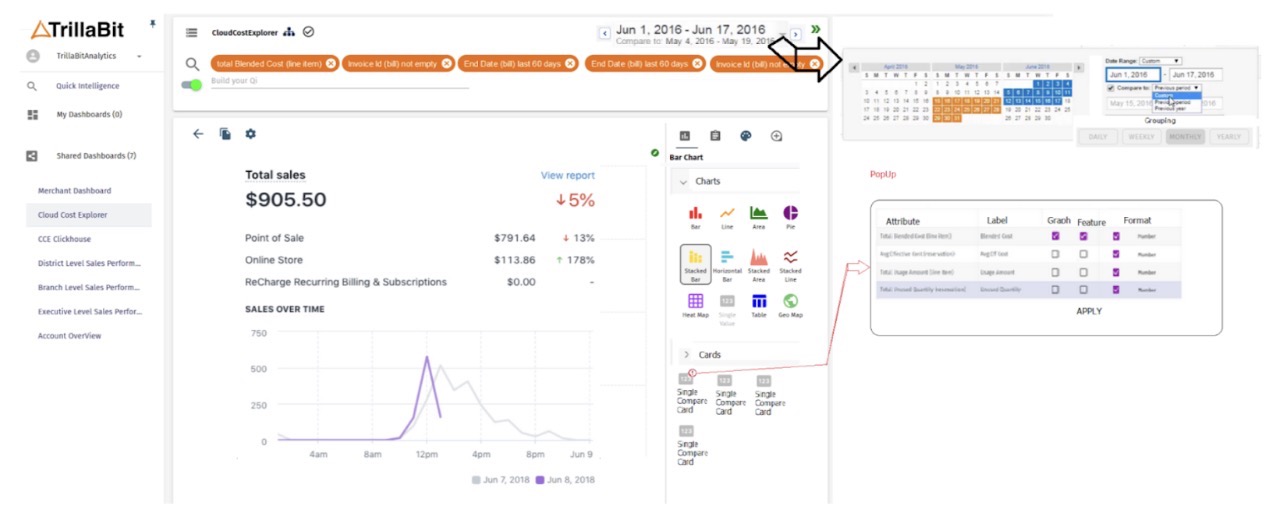
Analytic cards are used by leading SAAS platforms. Essentially they are a combination of metrics displayed in a way that’s easy for end users to quickly understand, and in some cases further explore their data within some context.

Example

Here you can see an example of a Shopify Analytic Card. Note there are multiple Kpis shown with different labels and related comparison indicators. At the bottom is a trending graph with a comparative lighter trend line. The time frame for all of the KPIs and Trends on the card are driven from a common dashboard datepicker (which is another great TrillaBit Quick Intelligence feature).

These usually only provide fixed functionality and don't allow end users to create their own versions. Products like Shopify have prebuilt these within their own context and what users can modify is limited to predefined configurations.

Trillabit has figured out a way for end-users to easily create and publish groups of analytics for other users as self-service.

We’re not just building out flat cards like many products have done. We've given our cards all the same capabilities and drilldown to raw data that you find throughout our product. Analytics shouldn’t stop at the first result, you’re going to want to dig and see what’s really going on. What makes up that result and where the most interesting insights are coming from.

A distorted mockup for ip purposes
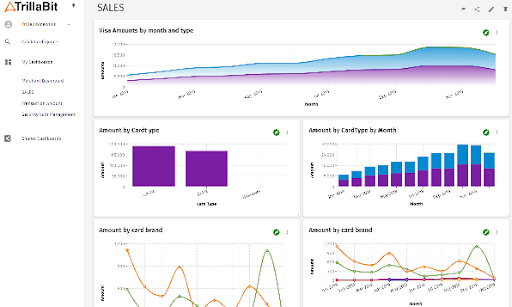
For B2B SaaS providers, this capability enables Product Owners to quickly produce meaningful and user friendly dashboards for their clients on the fly or for their “out-of-the-box” analytic solutions.

But we’re not stopping at one type of card. TrillaBit is enabling a library of cards to choose from so you or your clients can quickly and easily build out your ultimate dashboards and cards without the need of costly development pipelines.

Why?

Let us explain a little around why we feel our general approach is important.

TrillaBit’s vision is to make data easily accessible to everyone.

Strategic Necessity

Implementing analytics in B2B SaaS products is crucial for empowering end users with actionable insights and improved decision-making. Not only does this enhance user engagement through interactive dashboards and customizable reports, but it also enables product improvement through feedback loops and understanding user behavior.

The competitive advantage gained from offering advanced analytics, coupled with revenue growth opportunities and improved customer retention, makes it a strategic necessity. Moreover, timely access to data is essential, ensuring that users can make quick, informed decisions and react promptly to market changes, ultimately driving success for both the end users and the SaaS company.

Timely Answers

Timely access to answers directly impacts B2B SaaS end users' ability to make informed decisions and stay competitive. In rapidly evolving business environments, quick access to data insights enables users to seize opportunities, mitigate risks, and adapt strategies swiftly. Timely answers allow users to respond quickly to changing circumstances, whether it's identifying market trends, understanding customers, or optimizing operational efficiency. This agility fosters innovation, improves productivity, and ultimately drives success for their businesses. Moreover, in today's fast-paced world, where every moment counts, the ability to access timely answers ensures that users can make the most of their valuable time and resources, leading to better outcomes and a stronger competitive edge.

Benefits to B2B SaaS

Providing analytics in B2B SaaS products not only benefits end users but also offers substantial advantages for the SaaS companies themselves. By demonstrating return on investment (ROI) and showcasing the measurable impact of their product through analytics, SaaS companies can build trust, credibility, and long-term relationships with clients. These analytics demonstrate the tangible value that the SaaS product brings, illustrating cost savings, revenue increases, efficiency improvements, and other key performance metrics. Through clear ROI metrics and reports, clients can see the direct correlation between using the SaaS product and achieving their business goals, leading to increased customer satisfaction, loyalty, and potentially upsell opportunities. Additionally, by understanding how clients are using the product through analytics, SaaS companies can further tailor their offerings, optimize features, and develop targeted solutions, ensuring on-going delivery of value. Ultimately, providing analytics for ROI not only strengthens the SaaS company's position in the market but also solidifies its role as a trusted partner in its clients' growth and success.

Guidance from Power Users and SMEs

insight

While enabling data exploration for everyone through drilldown to raw data and search based querying with immediate visualizations, we’ve learned that many end users still need a great deal of guidance.

In B2B SaaS companies and specifically the power users within the organization, there exists a deep understanding of the businesses intricacies and needs. These individuals take on the pivotal role of preparing data in a manner that is easily consumable and actionable for their colleagues or clients, who may not possess the technical acumen to create them themselves. This involves translating complex datasets into user-friendly dashboards, selecting pertinent key performance indicators (KPIs) that align with specific objectives, and crafting visualizations that resonate with the business goals at hand. These power users are instrumental in delivering templated data visualizations that empower their colleagues or clients to explore and make informed decisions without the need for extensive data manipulation or analysis. This strategic approach ensures that end users, with their own grasp of business context, can effortlessly consume and derive thier own personal insights from the configured visualization or card. Ultimately, this collaborative effort and culture of data-driven decision-making enables entire organizations to leverage data effectively and achieve their desired outcomes.

Revolutionizing Dynamic Dashboard Creation

With a self-service tool such as TrillaBit Quick Intelligence combined with Analytic Cards to provide guidance, we are revolutionizing the dashboard creation process. Power users can use these cards as templates for individual KPIs or groups of KPIs within dashboards - swiftly and effortlessly assembling impactful, intuitive data visualizations. By following the layout and design principles of the proven products like Shopify and others, Analytic Cards guide users through selecting relevant comparative metrics, choosing suitable chart types, and arranging visualizations for maximum clarity and impact. With features like guided drilldown, color palettes, and layout options, power users can easily customize the cards to suit their specific needs. This approach not only streamlines the dashboard creation process but also ensures that even users with limited design or technical skills can produce polished and insightful presentations. The results give power users and non-technical business analysts the ability to quickly generate compelling, user-friendly dashboards for clear communication of insights and informed decision-making within their organizations.

We will keep you posted on further developments of Analytic Cards other exiting upcoming features. Feel free to reach out to us at [email protected].

Thanks,

Keith

quote

“We are the music makers and we are the dreamers of dreams” ~ Willy Wonka"

contact us!

· One min read

We are very excited about the year ahead as we bring out more advanced capabilities, manage strong growth, and support our existing customers.

It's a new year and a new look. We've been busy improving our product with better UI, geocoding support, and more.

Cheers!

The Trillabit Team

· 5 min read

ß TrillaBit Quick Intelligence is a robust SaaS platform for reporting and business intelligence, utilizing the power of ClickHouse for fast scalable results. Today's reporting tools are simply not dynamic enough for users to ask new questions and get results back immediately. Not without having to go through a timely and costly development life-cycle.

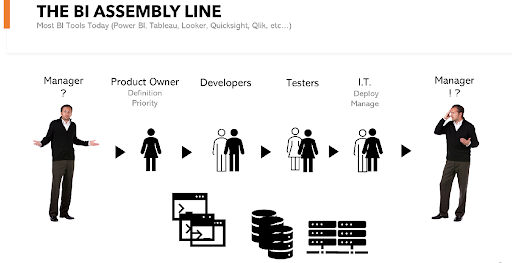
BI Lifecycle

They also commonly depend on expensive expertise to implement, maintain, and run the supporting systems. When development teams want to spend time on new and exciting creations, they're often pulled back into a business user's new question. They are then forced to build out the new query and KPI, QA it, deploy it, so that the business user can finally see it. Once they see the results they have even more questions which keeps this vicious and costly cycle going.

Working with ClickHouse

ClickHouse wasn't TrillaBit's first love. Solr originally caught TrillaBit's eye. Why not?! TrillaBit is a search-driven analytics platform, so why not use a search-driven data backend. Solr is capable of some levels of data aggregation, the models are dynamic and the indexing is ideal for search purposes. However, TrillaBit soon ran into a number of challenges. Solr, being a key-value store is more suited to search than it is to high volume aggregation or data compression for performance. Its query language isn’t as broad or established as SQL. It doesn’t handle joins well and is not ideal for managing data. TrillaBit experienced far too much pain managing and getting Solr to perform at scale. So when TrillaBit’s eyes began to wander, ClickHouse showed the most potential as an alternative.
TrillaBit quickly found a new favourite. ClickHouse has a huge number of built-in functions, supports data clustering and is built for both data management and analytics. It handles joins and materialized views with ease. The different table engines [ReplacingMergeTree, AggregatingMergeTree, MergeTree, S3 table engine] all help with different data management use cases for different client needs. The community version is Free and helped TrillaBit get started at a minimal cost As TrillaBit grows, ClickHouse is able to keep pace with the ClickHouse Cloud. Helping even data experts like TrillaBit scale and manage their clusters.

Exploring your ClickHouse data with Quick Intelligence

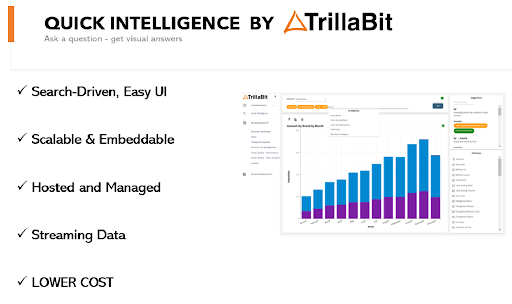
TrillaBit is solving the BI Assembly line problem in a cost-effective way. The Quick Intelligence platform allows users to ask a question in a search bar and get immediate visual answers. Example Question: Total Sales by Sales Rep Last Month Utilizing ClickHouse because of its incredible performance at scale, it finds the data and instantly graphs it for you. Once you visualize the data you can easily drill down into the area of interest to uncover further insights and expose record level detail at any point. A metadata driven system allows business users to explore data in their own way, asking new questions and getting immediate answers in seconds.

Quick Intelligence Features

Save and Share

When users find something interesting and valuable in their data, they often want to save and share with others, either inside or outside the tool. There are many ways to do this. Creating dashboards on the fly and sharing them with individuals or groups is one way. With Quick Intelligence, this is as simple as pinning visualizations to a dashboard or creating a new one in seconds.

Users can also export their KPIs as images for PowerPoint presentations, word or email. You can also drill right down to the underlying raw data and export it to Excel to share with a colleague.

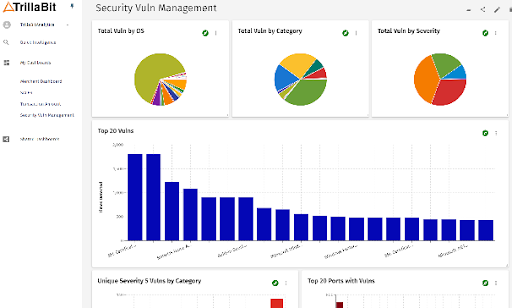
Quick Intelligence Features Quick Intelligence Dashboard

To Embed or not to Embed

Companies that want to use this functionality as their own have the option to embed Quick Intelligence into their own product. They can skin it to look like their own brand or to look like any of their client’s brands at the account level. Other companies who want to use this internally are able to have all of this functionality in a standalone UI. Additionally Standalone and embedded are available in a single implementation. For the best of both worlds.

Quick Intelligence Share1 Quick Intelligence Share2

Security and scale

TrillaBit Quick Intelligence utilizes ABAC policy control. It allows for multi-tenant within multi-tenant capabilities and can secure data for many departments. A large part of the backend scalability comes from the efficient performance of ClickHouse. Whether it's YOUR ClickHouse environment, the ClickHouse cloud or have TrillaBit manage everything, the product is versatile and able to handle several configurations. TrillaBit scales to IoT and network level traffic speed and size of data, trillions of rows. Providing real time analytics.

Getting Started with TrillaBit on ClickHouse

TrillaBit is an enterprise grade platform. If you have ClickHouse already, TrillaBit can connect to it and you’ll be up and running in no time! TrillaBit is metadata driven, so the only thing required is the data. If you’re looking to run your own data warehouse in ClickHouse and have TrillaBit run on that, just let TrillaBit know. They’ll work with ClickHouse and guide you through the whole process. If you want to be completely hands-off, TrillaBit can handle the end-to-end process for you. Your business users or clients will be able to just start exploring on their own and gathering insights. sPlease feel free to reach out: [email protected]